Project management: key figures at a glance
Running projects gets complicated when you need to keep track of sales, costs and commissions at once. Now the figures that matter are on the same screen.
Consiga Soluciones 4 min read
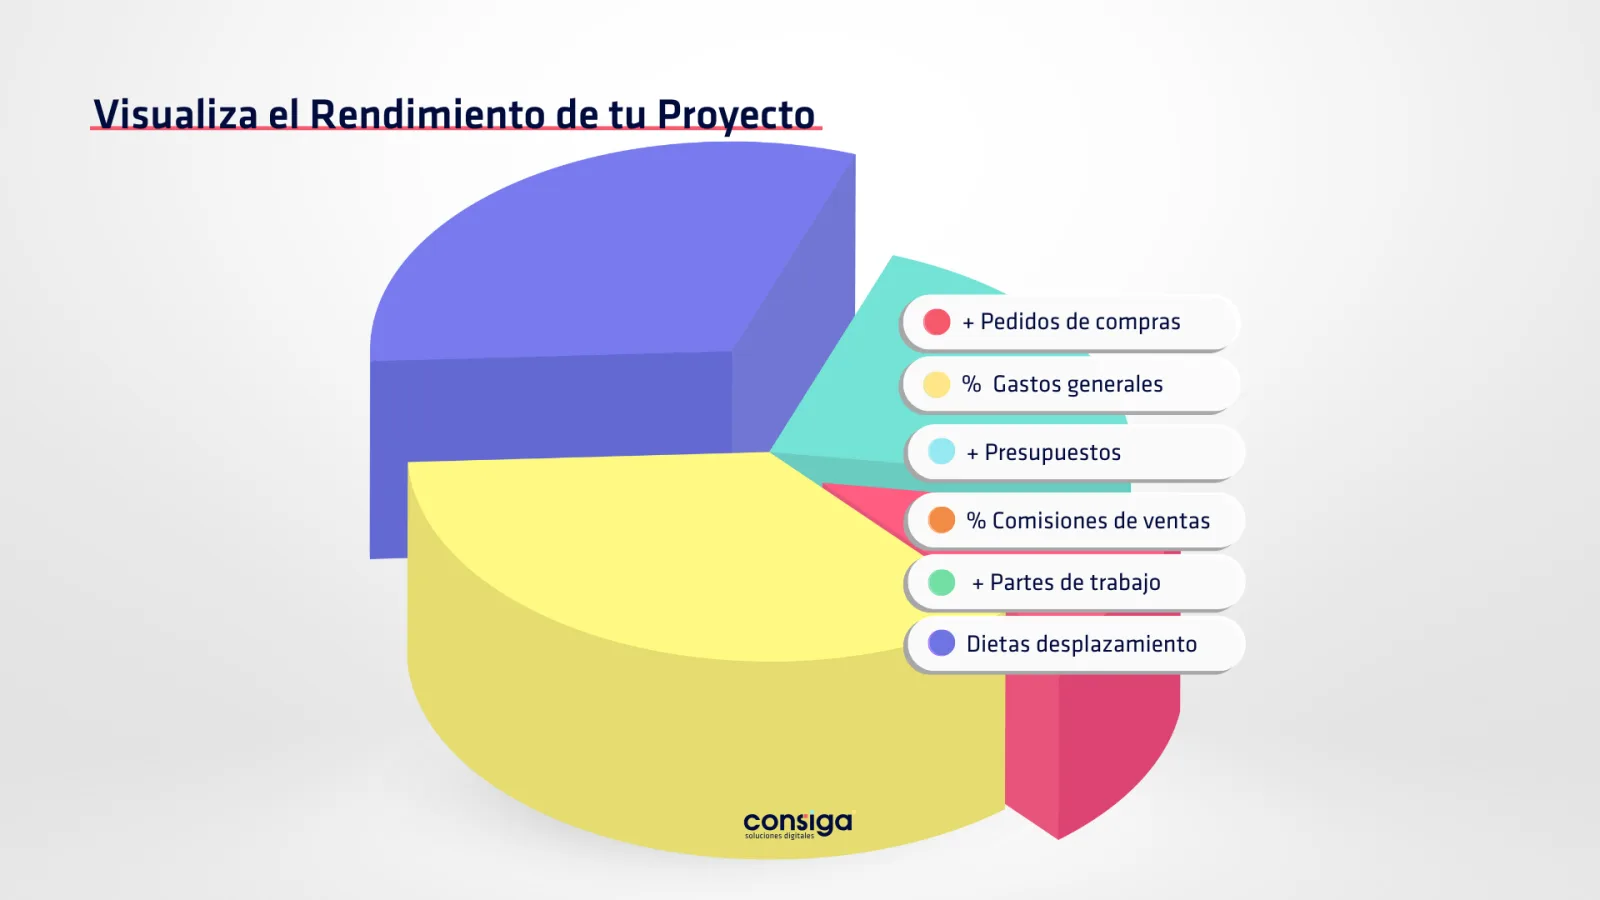
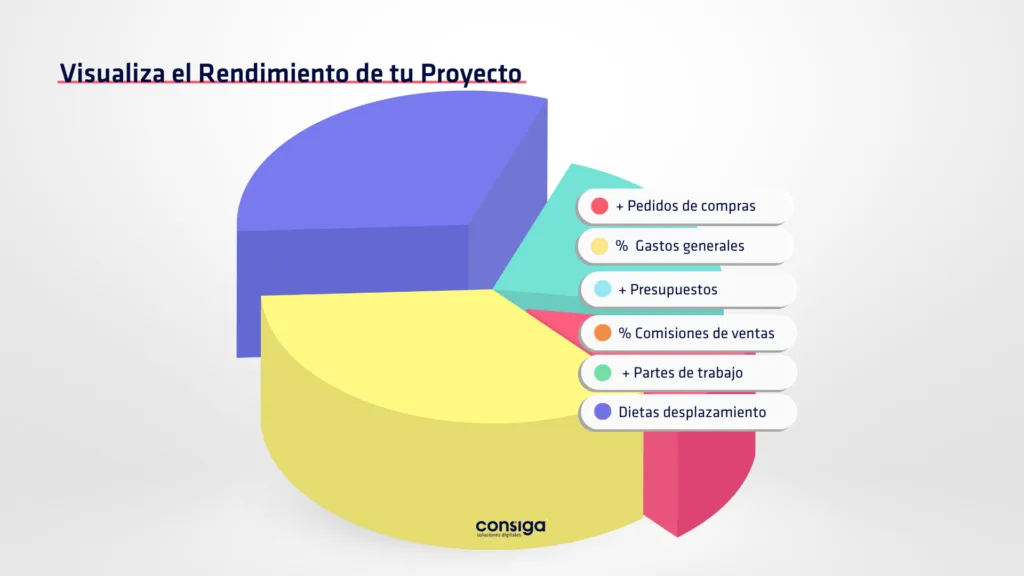
Running projects gets complicated fast, especially when you need a close eye on sales, costs, commissions and everything else that moves. To make that easier we have released the new "Project Result" tab, which lets you see how each project is performing and where it stands, clearly and in detail, through an interactive chart that takes no explaining.
What the "Project Result" tab is
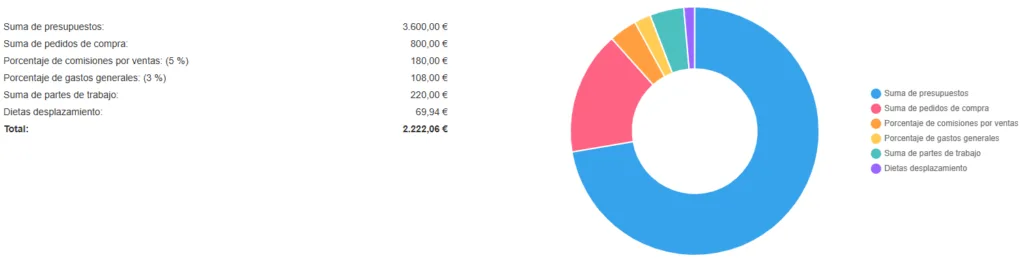
The "Project Result" tab gives you the whole financial and operational picture of a project in one place. A live pie chart puts the key numbers in front of you so you can decide on what is actually happening.
Among the figures you can see:
- Product total: the total value of products tied to the project, which tells you how far along the stock or purchasing side is.
- Purchase order total: the total value of orders placed for the project, so you can keep the workflow and buying under control.
- Sales commission (%): what share of total sales goes to commission, essential when you are managing incentives for a sales team.
- Overheads (%): a clear view of the general costs attached to the project, so the budget stays where it should.
- Work sheet total: all work sheets generated for the project, which shows how the assigned tasks and the work done are progressing.
- Allowances and travel: the total spent on allowances and travel for the project, which matters for keeping operating costs in check.
Why the chart matters
"Project Result" gives you a clear, accurate view of everything that counts on a project. With it you can:
- Watch the project as it moves: see sales, costs and commissions change in real time and adjust straight away if you need to.
- Decide on real numbers: with the key data drawn out, you spot what needs attention quickly and put people and resources where they are needed.
- Keep the budget in hand: knowing overheads and travel costs at a glance means no unpleasant surprises and no drifting past the budget.
- Improve what the project earns: with commissions and margins broken out, you can judge real profitability and find where there is room to do better.
What you get from "Project Result"
- The whole picture: everything relevant to the project in one place.
- Live tracking: the chart updates continuously, so nothing catches you out.
- Better use of resources: seeing performance visually makes it easier to put what you have where it does the most good.
- Easy to read: the chart is clear enough that anyone on the team can see where the project stands without any analysis.
Turn it on, free
This is built to give you full control over your projects without adding work, and you can switch the "Project Result" tab on free of charge. If you want to start running projects better, get in touch, no obligation. Our team will be glad to help you fit it into how you work and get everything out of it.
Take the chance to have your projects fully in hand and decide on accurate, visible data.
Ask us for more information.